Sunday, September 29, 2013

09/29/13: Haven't updated awhile, seeing continued downside into Tuesday

Been busy in my personal life recently so haven't had much thought in updating the blog frankly.  Anyway, decided to put up a quick update.  Futures look like they are down ~75bps, mostly because of the likely government shutdown (or maybe because we entered into a down cycle long before?).

I don't really delve into the politics since I just care about being on the right side of the trade.  I did initiate a small short on Friday so unless something magical happens between now and the open, this trade should be in the money (overall, still burnt by the 9/18 rally so in the grand scheme of things, just trying to make back the money I lost on that day).

I've also started playing around with the gold miners (NUGT and DUST).  Not for the faint of heart.  Even for someone like me who plays around with SPXU and UPRO, the volatility in NUGT/DUST can be ridiculous.  The reason I entered into the fray is because I really think NUGT is near or at the bottom of this long awaited cycle.  I certainly could be incorrect but right now, as it stands, I think NUGT stands a good chance of seeing a healthy rally.  Anyway, time will tell.

Looking for UPRO to fill the gap around 71 which is the SPX equivalent of 1674.


Sunday, September 15, 2013

09/16/13: Up into Tuesday, tomorrow is going to suck (for bears)

After a dismal weekly performance, I went back to the drawing board to revise the system.  A system that fails to identify these strong trends is worthless in my opinion, so given the fact that my system missed this rally (and was on the opposite side) it was time to review.

I reviewed quite a bit over the weekend and was looking forward to starting anew, but today when I looked at futures, Eminis are rallying 1+%.  Holy cow, that's going to suck tomorrow.  Thought there might be a reprieve to cover the shorts at a better price so now I'm pissed I'm going to cover at worse prices.

There were a couple problems with my system
1.  In the v2, I would take positions at the start of the timing window.  Initially I thought this was ok, but instead I really ought to take action at the close of the timing window.

The reason is there have been a few instances in this rally (and others) where it seems the Aroon 3 flips from positive to negative (or vice versa) by the time the hourly bar is done.  If the Aroon 3 turns negative, then I want to be taking the opposite position (if Aroon is negative, go long and conversely if Aroon is positive, go short).

A recent example is the hourly close on September 6th.  The hourly bar flipped Aroon to negative but at the start it was positive.  Hence why I took a short position at the start.  What should have been done was taking a long position at the close.

If I had taken the long, then I wouldn't have been entering the next leg of the wave short.

2.  the other problem was holding onto these shorts far too long.  I violated one of the basic tenets in not honoring my stops.  Really bad sequence of events this past week and a half.

Anyway, here's looking forward to the next several months.


Wednesday, September 11, 2013

09/11/13: Instead of a high at 10am EST, we had a low - ST long

Offset a couple batches of shorts with one batch of long so net short 1 batch of shorts.  Today we ended up getting a low at 10am EST rather than a high.  Given the low at the timing window, it looks like this wave doesn't want to relent.

After surpassing 1687, the next target is approximately 1697 which is the upward sloping backtest.

The next timing window is 9/13.  Perhaps the high occurs on 9/13?  We have a full moon heading into 9/18 so that's a possibility.


Tuesday, September 10, 2013

09/10/13: Possible high tomorrow 10am EST

Markets popped at the open and never looked back.  Hourly OBV on the SPX broke its downtrend materially by the end of the day.  However, there is still a significant divergence between hourly OBV and where price is at.

SPX OBV is at a level below 1660.51 which was the high back on 8/26 pre-Kerry speech.  SPX needs to keep pushing forward for the next several days in order to wipe out this divergence, but this seems really unlikely.

Since OBV is showing negative divergence, I am waiting for a move down below 1660.51 at minimum.  Don't get me wrong, long term this market is UP.  My long term accounts are all in SPX but swing trade on the short term account.

These waves are the worst in my opinion because they are designed to second guess your thesis.  Such a strong, impulsive move makes you wonder if this is start of some wave 3 of 1, but it's so damn close to where you think resistance is and where this wave ought to stop.


Looking forward to tomorrow, timing window is at 10am EST.  Possible high?  If it's a high then I'm looking for a move down into 9/13 which is the next timing window.

The saving grace I have is the UPRO hourly OBV.  UPRO still hasn't broken its downtrend OBV.  I am not sure if leveraged ETFs hourly OBV is reliable but am taking a look here.


Monday, September 9, 2013

09/09/13: Tomorrow's opening half hour is very important

There are two items I am watching heading into tomorrow's kiddie hour
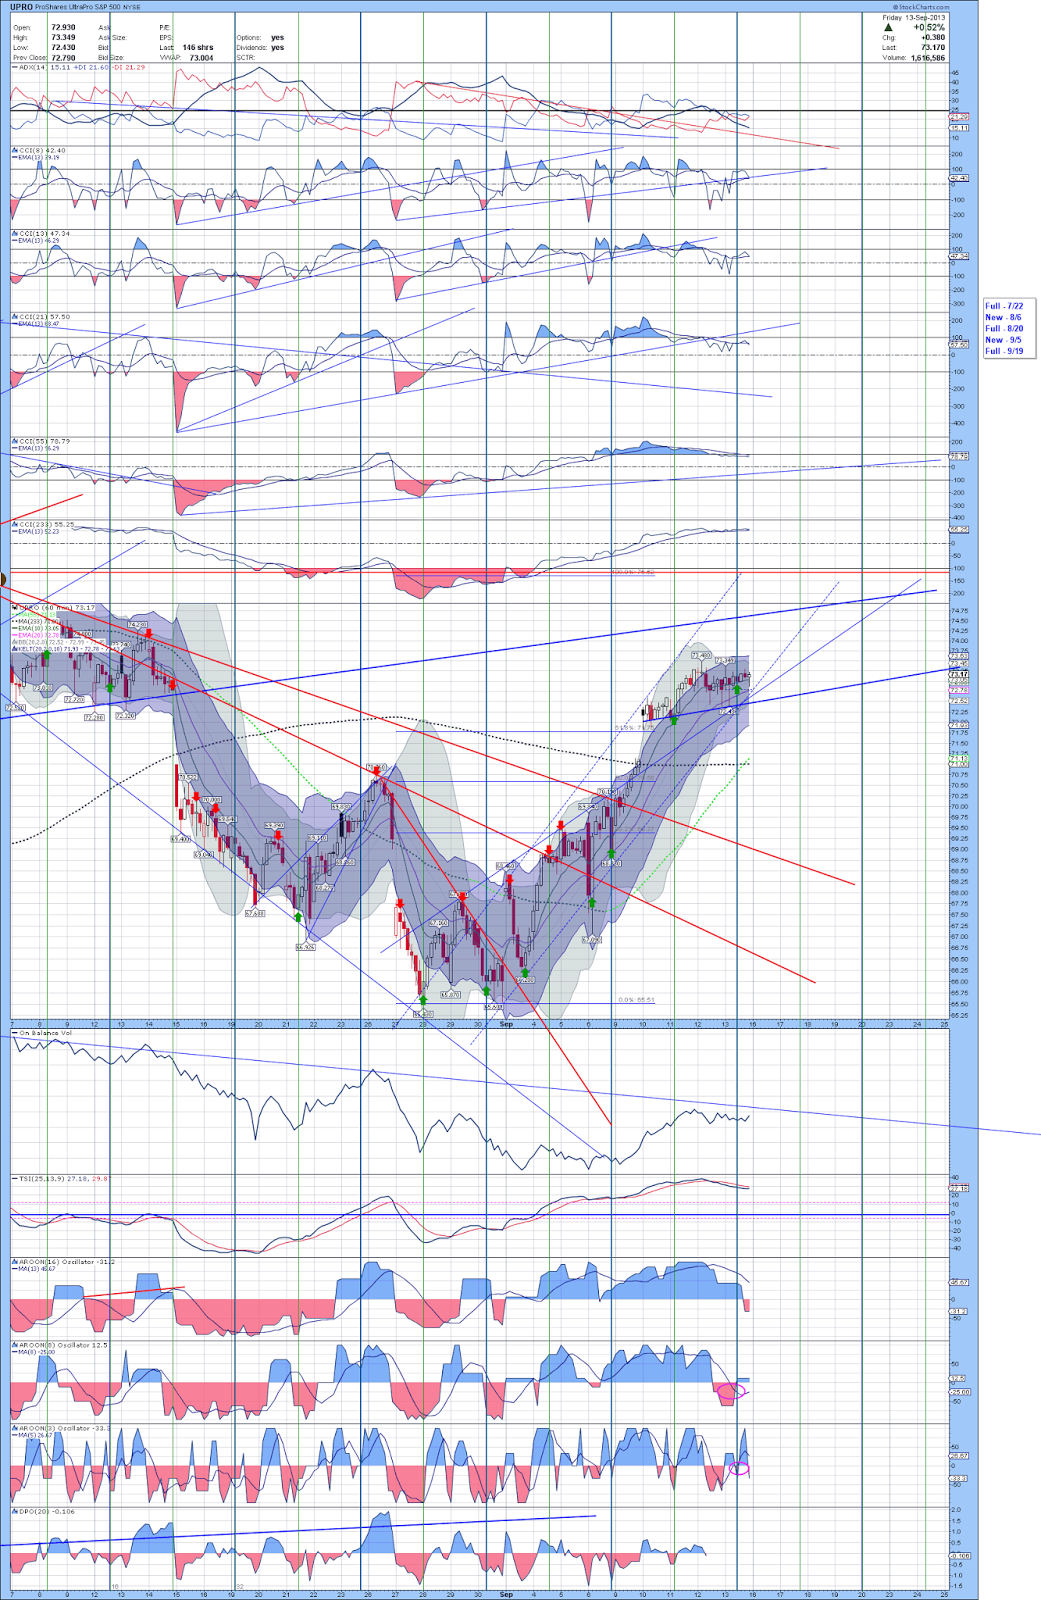
1.   Hourly OBV trend (circled in pink)
2.   233 hour moving average

Why these two?  Today's move had us closing right at the edge of the OBV downtrend.  Price meanwhile broke it's downtrend AND also closed above its 200 hour moving average.  Does this mean that the bears are toast and the bulls have it all?

It is hard to say until all evidence unequivocally points to one direction.  Right now, the bulls have price in its favor but volume has not supported the break yet.

Why I say the kiddie hour is going to be important is because if we close the kiddie hour with a strong move up then it is off to the races because OBV would break its downtrend.  If, however, either of the following happens, then we have a possible failure and the resumption of the downtrend:

1.  Pop and drop: maybe some data point is bullish or someone says something which causes markets to pop at the open.  If bears don't beat it down then this wave up may in fact be bullish.

2.  Gap down: I would totally prefer this since it leaves no doubt on the table that new lows will be visited.


The second item I listed is the 233 hour moving average.  Why do I use the 233 hour moving average?  First of all, 200 MA is widely used by novices and is the default setting for many software.  To get somewhere in this game, you gotta take some chances at looking at other angles.  You may do your due diligence on this but you'll notice the 233 MA is very good at tough resistance or support.

You may notice if you have the 200 MA set, we closed above that on an hourly basis.  This would tell a lot of people to be bullish but look at the 233 MA!  SPX failed to close above.  It tried once and got beaten down and it tried again in the final hour.

Therefore, these two are very important going into tomorrow's open.  Good luck.


Sunday, September 8, 2013

09/08/13: Looking ahead to this week

To me, SPX is nearing completion of this rising bearish wedge which, after completion, targets the origin of the bearish rising edge...in this case 1620s.

My belief is that we are still in Wave B of intermediate wave iv.  This means a devastating C wave is yet to start.  The preliminary target is around 1580.  I believe this will generate enough bearish sentiment to give the markets one large wave up.

Looking towards Monday, there is the potential for the markets to test 1661 and maybe move up to 1666 again.  This would not violate the rules of the bearish wedge.  If there is enough euphoria build up, then it's possible to see 1670s.  I am keeping this in mind since I am always thinking about risk management.

Currently holding 2.5 lots of short SPX (via SPXU).  The entries are marked with the red arrows.  The next timing window is the 11th.


Wednesday, September 4, 2013

09/04/13: Shorting SPX, looking for lower low ~1600

We've had a roller coaster ride the past couple of days with serious swings on both sides.

To me, the market is probably completing a wave B of iv.  If that is the case, then we should be peaking soon and then another swift move lower (approximately 80 points if A=C) to take us to roughly 1580.  Whatever it is, it is likely below 1600.

I really don't think we are going to new highs yet.  The scenario I am going off of is we move down to 1580s late September which is right around where super-long term support is now (this is the meridian line dating back to the 1930s).  We crossed that resistance line before the Boston bombings and the bombings took us down to support level.  After the test, markets rallied huge and are now in this more expansive corrective pattern.

If 1580s holds, then we are likely heading > 1705, maybe to 1750.  That would be ideal in my opinion.  If we fail (really don't want to get into this whole Syrian mess), then we could be ushering in a brutal bear trend.

Anyway, I've marked in pink where possible grind higher could go.  OBV is showing a disconnect here...it's made lower lows but price hasn't.  Usually OBV is a leading indicator and tells us we are heading lower.