The following is a review of the past week.
Goes without saying: please do your own due diligence and evaluate your own risk tolerance.
For more up to date information, you can just follow me on stocktwits: runner417. I plan to just use the blog as a "weekly report card" and "pontification session."
Charts to be posted later.
Overall Grade: C-
Past week's calls could have used some improvement. Overall next week, I'm feeling optimistic.
NUGT [F]: First of all, the overweight position in NUGT stopped out twice (because I bought back later). I did flip to DUST for a bit but the point is the call on NUGT didn't pan out at all, not even close.
After reviewing the charts again, I realized that I misinterpreted reading one of the cycle charts for NUGT. Moving forward, I think I have a better grasp of reading the cycle and will evaluate more as we go.
UGAZ (natural gas) [A] is a winner, and I think it will continue to be a winner into first week of December after it corrects Monday.
EDC/EEM [A] are both setting up to be winners heading into first week of December. The correction this week was expected after the rapid rise (and emotional gap up off of cycle high). Emotions are now reset, and should be free to run this week.
UVXY (vol) [C] short term pop was accurate but next time I would rather not even bother posting something so short term. It remains something to stay away from for the time being. Vol WILL catch up...nature finds a way (Jurassic Park flashback). It is nearing the end of a massive cycle and by the looks of it 2014 is going to be one crazy year. 2015 will be crazier (overall a "minor" correction in 2014 to be followed by a massive run up like 2009 into EOY 2015. Don't miss that run up because that could be the bubble of the bubble. I say minor because a 20-30% decline means nothing after a +150% runup). Maybe nature is getting very angry that nothing has been resolved on the debt ceiling, government spending front. Some market volatility can adjust that properly.
YINN (china) [A] works similarly to EEM but not really. YINN is also setting up for a run into December. China did pass notable reforms this past week, ones that stood out to me were abolishing the one child policy and allowing more private investment, less government intervention. The beneficial effects of this should be felt years from now but the market will price this in over time. You should see the baby stocks in China after the reform change. Pricing it in already:
http://www.reuters.com/article/2013/11/18/us-hongkong-babyshares-idUSBRE9AH01R20131118
That's the easy result of the reform change, but the underlying current is social. Single children have a very different view of the world versus those that have siblings. This can open up China and be more creative. There is a lot of pressure on single children and having siblings will ease the burden. I see this as being hugely beneficial 20 years out.
Despite what views you may have of China, the way the government is setup picks the strengths of different government types. First, the decisiveness of government and two the strengths of a capitalist economy. The future remains murky for US economics but Chinese economics remains very bright.
SPX [C]: trickiest chart of them all. There was a brief correction that was really a wave 4 and we likely ended wave 5 on Friday. ABC correction next then another buying spree into year end is the call...wave B should coincide with day before and after thanksgiving. Wave C probably be blamed on some "lower than expected Black Friday results." I really don't factor news in my trading because it's really noisy and I find it hard to believe that some reporter can dictate which way the market goes.
DRN (real estate) [C]: DRN is following a similar cycle to NUGT just not as bad so I readjusted the cycle interpretation, and we'll see this week. I think it bottomed and is heading short term higher to the 40s
TLT [B]: The correction midweek is likely an expanded flat (so wave B cut below wave A), so we should overshoot back up in wave C. Re-adjusted short term cycle for this. I did make some intraweek trades on TLT and so far have worked out ok so I will stick with the cycle.
A new one that I will add to the mix is oil (UCO or USO). I really think oil bottomed this past week and is ready to move up for longer term buy. I question how can oil be down so much when stocks are so high?
---
I will write a separate discussion on cycles and how I use them in my analysis in the future. In summary, I've seen more than my fair share of various indicators and I believe the theory that gives me the best confidence entering a trade is cycle theory.
It is the one theory that eliminates as much as possible the "what if" questions that pop up in my head. "what if the moving average does X or what if this wave is really a 3 legged up wave rather than 5?" These types of questions can easily affect an otherwise sound trading decision.
With cycles, the natural rhythm and flow of waves and how waves amplify when cycles overlap is something i have found to be the most intriguing and oddly, the most serene feeling in trading. I guess once you figure out the cycle and morph with that asset as "one" you see where the price goes beforehand and literally feel what market participants are feeling and it's amazing to see how that can work. Sounds hocus pocus, but I never one believed that analyzing markets needed a PhD.
It makes sense, the problem is interpreting the cycles right. Once you determine the master cycle for a given asset, you can capitalize on short term emotional trading (i.e. stock gets beaten down but cycle is up...what that tells me is at some point once the emotional trading is out of the way, the stock just flat out rips to catch up.) Nature has a funny way of correcting itself. Really really interesting stuff.
I use cycle theory to figure out the time aspect, then use standard TI to figure out the price aspect. I then use Elliott Wave to determine how best the wave will end. All of this stuff is not easy at first but once you become one with nature and the natural rhythm, it is quite eye opening.
Saturday, November 23, 2013
Sunday, November 17, 2013
11/17/13: The week ahead
Likely catalyst this week: FOMC Minutes 2pm EST Wed, so will be cautious on existing positions moving into that time frame.
The following are top ideas, current, and potential positions. I am deviating away from purely posting SPX (seems to get boring and secondly haven't made the right calls past month :p) Some are duplicative of what I posted previously. Goes without saying: please do your own due diligence and evaluate your own risk tolerance.
I intend to update this at the start of the week, mid week update, and EOW review. For more up to date information, you can just follow me on stocktwits: runner417.
Top 3 Ideas - week of 11/17/13
1. Long NUGT [Gold Miners] (discl: O/W position on NUGT)
Looking for explosive move in NUGT this week. Potential IHS, positive reversal on CCI 8 (short term momentum), falling bullish wedge on hourly on Friday, extreme negative sentiment on gold miners, IT/LT hourly cycle moving up, ST cycle bottomed on Friday.
Potential max target ~high 50s so a move of approx. +30%-40% potentially
A gap down Monday may nix this setup so I will be watching before market hours and open.

2. Long EDC/EEM [Emerging Markets] (discl: no posn currently)
Huge gap up on Friday indicates big time mood change. Emerging markets has significantly underperformed SPX during the past several months, needs to play catch-up a bit. Possible asset allocation among fund managers as SPX has been in semi-melt up mode but similar risk assets have been imploding. Looking for a minor retrace to digest gains Mon/Tues and then a possible completion of a C leg up from 28.5 to 32.5 [EDC] (approx 10-15+% move)

3. Long UGAZ [Natural Gas] (discl: no posn currently)
Natural gas has been a short's heaven ever since 2009. I'm no pro at the underpinnings of natural gas but based on the chart I see and from evaluating the cycles, I'm looking for a retrace to around 13.5 on UGAZ Mon/Tuesday and then a rise into end of week with the potential of capping in the 16-17s range so this translates to an approximately 20-25% rise from 13.5. I think natural gas has the potential for making a bullish run.

Existing Positions outside of Top Ideas for this week
1. Long TLT [20Y govvies] [discl: long]
Big picture I don't like government bonds at all but TLT's been beaten down quite a bit and the LT/ST cycle hourlies are moving up this week so hence I'm long. I will look to be disposing TLT towards end of the week. This doesn't generate enough ROA to allow a decent allocation but I thought it was oversold enough.
The long term bond bull run is nearing its end and we're probably at the cusp of the turning point. I think there has increasingly been negative sentiment towards bonds so bonds are going to zigzag all the time but bottom line is it's not something I want to own into 2020. With the billions of $ in bonds, this money will eventually flow elsewhere and it's going to go into the cream of the crop assets....that very well likely could be one last MASSIVE melt up run into stocks (current meltup will look like kiddie meltup when this goes into hyperdrive). Think about it, when you manage your 401k the top two choices are bonds or stocks. Well, if bonds are hitting the crapper, then your other alternatives are stocks and cash. Since stocks are performing so much better and Fed rates near 0, what else can you do?
So moving into next two years, bonds are going to get hit hard and stocks are going to the moon. This might be the last bubble for stocks and in this case it's the entire US stock market (not just some sector like housing or tech). This has very dire consequences and a crisis that will make 2008 look like it was nothing. Meltups never ever end well (go back 1000 years and look at every bubble that has transpired). That is the concern moving into two years from now. In the meantime, there is nothing one can do about it but it will come like winter arrives after fall.
2. Long SPXU (short SPX) [discl: long]
What has been frustrating this year has been the SPX. Didn't think the semi-meltup would be this quick but lo and behold this year SPX is up +25% YTD. Wow. Anyway, I missed the October rally and have not been right in November as well so it gives me some nervousness to make a call on SPX.
I have a tight stop on SPXU but STILL think a near term correction is in the works before another rally into year end.

Potential Positions outside of Top Ideas
1. Long UVXY [volatility]
This goes hand in hand with a short SPX call. UVXY looks to have bottomed ST so I'm trying to get a 5-10% pop on this before selling it. Can't hold this thing for any longer than a few days.

2. Long YINN [China]
China released sweeping reform notably relaxing the one child policy. I think China is making the right adjustments as they position themselves in the early stages of what is clearly a massive up cycle. China reminds me of the late 80s US so it's time in the spotlight will come. There will be more and more opportunities in China.
YINN popped huge on Friday (+10%). I think there is a small retrace and then I want to position myself for a leg up towards EOW.

3. Long DRN (Real Estate)
I don't really know what to make of it but RE, commodities, emerging markets have all sucked hard while SPX has been making new all time highs each day. Real Estate looks to have made a short term bottom so I'm looking to grab a position this week for a leg up.

The following are top ideas, current, and potential positions. I am deviating away from purely posting SPX (seems to get boring and secondly haven't made the right calls past month :p) Some are duplicative of what I posted previously. Goes without saying: please do your own due diligence and evaluate your own risk tolerance.
I intend to update this at the start of the week, mid week update, and EOW review. For more up to date information, you can just follow me on stocktwits: runner417.
Top 3 Ideas - week of 11/17/13
1. Long NUGT [Gold Miners] (discl: O/W position on NUGT)
Looking for explosive move in NUGT this week. Potential IHS, positive reversal on CCI 8 (short term momentum), falling bullish wedge on hourly on Friday, extreme negative sentiment on gold miners, IT/LT hourly cycle moving up, ST cycle bottomed on Friday.
Potential max target ~high 50s so a move of approx. +30%-40% potentially
A gap down Monday may nix this setup so I will be watching before market hours and open.

2. Long EDC/EEM [Emerging Markets] (discl: no posn currently)
Huge gap up on Friday indicates big time mood change. Emerging markets has significantly underperformed SPX during the past several months, needs to play catch-up a bit. Possible asset allocation among fund managers as SPX has been in semi-melt up mode but similar risk assets have been imploding. Looking for a minor retrace to digest gains Mon/Tues and then a possible completion of a C leg up from 28.5 to 32.5 [EDC] (approx 10-15+% move)

3. Long UGAZ [Natural Gas] (discl: no posn currently)
Natural gas has been a short's heaven ever since 2009. I'm no pro at the underpinnings of natural gas but based on the chart I see and from evaluating the cycles, I'm looking for a retrace to around 13.5 on UGAZ Mon/Tuesday and then a rise into end of week with the potential of capping in the 16-17s range so this translates to an approximately 20-25% rise from 13.5. I think natural gas has the potential for making a bullish run.

Existing Positions outside of Top Ideas for this week
1. Long TLT [20Y govvies] [discl: long]
Big picture I don't like government bonds at all but TLT's been beaten down quite a bit and the LT/ST cycle hourlies are moving up this week so hence I'm long. I will look to be disposing TLT towards end of the week. This doesn't generate enough ROA to allow a decent allocation but I thought it was oversold enough.
The long term bond bull run is nearing its end and we're probably at the cusp of the turning point. I think there has increasingly been negative sentiment towards bonds so bonds are going to zigzag all the time but bottom line is it's not something I want to own into 2020. With the billions of $ in bonds, this money will eventually flow elsewhere and it's going to go into the cream of the crop assets....that very well likely could be one last MASSIVE melt up run into stocks (current meltup will look like kiddie meltup when this goes into hyperdrive). Think about it, when you manage your 401k the top two choices are bonds or stocks. Well, if bonds are hitting the crapper, then your other alternatives are stocks and cash. Since stocks are performing so much better and Fed rates near 0, what else can you do?
So moving into next two years, bonds are going to get hit hard and stocks are going to the moon. This might be the last bubble for stocks and in this case it's the entire US stock market (not just some sector like housing or tech). This has very dire consequences and a crisis that will make 2008 look like it was nothing. Meltups never ever end well (go back 1000 years and look at every bubble that has transpired). That is the concern moving into two years from now. In the meantime, there is nothing one can do about it but it will come like winter arrives after fall.

2. Long SPXU (short SPX) [discl: long]
What has been frustrating this year has been the SPX. Didn't think the semi-meltup would be this quick but lo and behold this year SPX is up +25% YTD. Wow. Anyway, I missed the October rally and have not been right in November as well so it gives me some nervousness to make a call on SPX.
I have a tight stop on SPXU but STILL think a near term correction is in the works before another rally into year end.

Potential Positions outside of Top Ideas
1. Long UVXY [volatility]
This goes hand in hand with a short SPX call. UVXY looks to have bottomed ST so I'm trying to get a 5-10% pop on this before selling it. Can't hold this thing for any longer than a few days.

2. Long YINN [China]
China released sweeping reform notably relaxing the one child policy. I think China is making the right adjustments as they position themselves in the early stages of what is clearly a massive up cycle. China reminds me of the late 80s US so it's time in the spotlight will come. There will be more and more opportunities in China.
YINN popped huge on Friday (+10%). I think there is a small retrace and then I want to position myself for a leg up towards EOW.

3. Long DRN (Real Estate)
I don't really know what to make of it but RE, commodities, emerging markets have all sucked hard while SPX has been making new all time highs each day. Real Estate looks to have made a short term bottom so I'm looking to grab a position this week for a leg up.

Friday, November 15, 2013
11/15/13: Current positions
Market fulfilled its IHS duties. Since today we didn't correct, I'm guessing Monday/Tuesday we do to make up for it. Afterwards, that retrace should be bought.
Longs
Long GDX/NUGT (gold miners): targeting around 60s on NUGT thanksgiving time (may revise this to high 50s) (chart below)
Long TLT (20y bonds): targeting somewhere around 107-108 next week or so
Long SPXU (short SPX): since Friday didn't bottom, took a small position with tight stop
Closed Positions
Long EDC (emerging mkts): huge gap up today so closed the position and am waiting for retrace next few days to re-enter and go long again
Planning to put on position
Long UPRO: when SPX short term bottoms Monday/Tuesday (hopefully)

Thursday, November 14, 2013
11/14/13: Flipping bullish through year end
Market is on a tear and on my short positions were stopped out. I did a reevaluation of where the markets stand now and it seems a couple cycles have inverted...at least that's my best guess. One of the cycles I look at (86 hours) is trending up while the 55 hourly cycle should be bottoming in the next couple of days. Given the market has held up very well through the 55 hourly cycle, I am thinking we will exit 2013 with a bang.
Not sure how far up the market goes but if both of these cycles are trending up while the past cycle was inverted then I see markets heading much higher. I guess the 1850-1900 crowd were right.
Anyway, took off the short positions.
Moving forward, I should disclose my other positions.
Long GDX/NUGT (gold miners): targeting around 60s on NUGT thanksgiving time
Long EEM/EDC (emerging markets): targeting around 31 on EDC thanksgiving time
Long TLT (20y bonds): targeting somewhere around 107-108 next week or so
Stopped out positions
Long SPXU (short SPX)
Planning to put on position
Long UPRO: provided Friday is a down day. It looks like 5 hour and 16 hour cycles are bottoming tomorrow.
Monday, November 11, 2013
11/11/13: Been awhile
Been awhile since I last updated. Since then, just been busy though at the same time, kind of disappointed we're in this sideways meandering market. Something's got to give...very soon. Traders don't like low volatility.
So I'm still targeting somewhere in the vicinity of 1600. Timing is off but ultimately the big picture is 1600. I guess I'm quite early, but looking for weakness into end of year. On the daily chart (not posted), it appears we're in this phase where the bulls feel like they can't lose and the bears are too afraid to short. So market has been quite successful in moving bears to the sidelines (or converting bears to bulls) and getting people off the sidelines to buy the dips (every dip has been bought regardless of how small) but we haven't moved up much since 10/21 (maybe 1+%?)
Our first inkling of some sort of weakness is the lower low put forth on 11/7. Bears viciously moved markets down to the lower band of kelt (using 3 standard deviations so in other words, the move was significant). Bulls bounced back and ripped bears a new one again and now we're back to square one.
At end of day today, I shorted again. My reasoning is our stop line (chandelier exit) has moved down and price has moved up. I imagine those with automated triggers at chandelier exits may have been stopped out giving some opportunity for others to take a stab. My stop is about 5% above my entry (so position size is small enough to not lose much on capital but at same time give some buffer and let this trade work).
My short term target is back down near the long stop (green line) achieving a lower low. Again, still maintaining a bearish stance into end of year.

Monday, October 21, 2013
10/21/13: as an aside
I posted this on daneric's blog regarding why I thought the next down wave ought to be larger than the more recent ones and figured what I wrote wasn't too bad:
I'm a believer that for the broad indices (not necessarily individual stocks), the news will fit whatever move the market makes. Market is up it's because of X and market is down, it's because of Y. To me, hence, news is meaningless for indices.
What matters to me is how investors react to what happens to the market? So let's say price starts going down...based on all the buying last few days and lack of support, there's a lot of stops to trigger. More stops triggered lead to more selling and it's a cascading effect. So, even though something small in the news may trigger the snowball effect, it's probably meaningless news in hindsight. By the time prices really snowball, then the media is like "Oh yea - it's because of X" and it's some big event that only becomes easily discernible after most of the damage has been done.
So what could be bigger than a default? No idea, but one thing is clear to me is how much worse we are at solving issues. Each drama has resulted in practically an 11th hour deal. This latest one almost brought the US to default (to the last day). It's hard to believe we suddenly figure out how to solve the next issue in a more timely manner. In fact the next issue is right around the horizon and time is running short.
To solve the issues, my hunch is the market wants to pressure decision makers way beforehand in order to urge decision makers to start resolving quickly.
Sunday, October 20, 2013
10/20/13: Looking for down wave to commence this week
Based on how the futures opened up Sunday evening, it seems like the markets want to pop in the morning. I'll look to add to shorts if that is the case.
Looking back on how I had forecasted, I did forecast a new all time high but revised it later. Maybe it's a lesson that I ought to stick to my guns a bit more.
Timing window wise, markets blew past a couple of the ones I was looking at. Usually if markets hit a high at the timing window then it takes a break into the next timing window, but in this case, the 16th and the 18th both ended up being highs. This tells me that the next down wave is at minimum 1720 (or around 77 on UPRO) by the 25th. We'll see how realistic this is.
There are numerous negative divergences floating around at the weekly, daily, and hourly level. There are too many to count...it's kind of pointless to list them all. At the same time, if this wave decomposes into 3 waves where A=C, then we tomorrow's pop will be as close as it gets to A=C.
The daily negative divergences are a bit egregious. Looking at the TSI, we've made about 4 negative divergences in a row. We no longer have a positive reversal setup on TSI...at each low this past year, TSI set up a positive reversal meaning a lower low on the TSI but a higher low on price. This generally leads to higher high.
In the most recent one that transpired, TSI did not make a lower low. At the same time, there is a large NYMO negative divergence. This seems to indicate to me that the next trip down will break our support line and head to 1600 (which is approx the 200MA - I use 233 as a fib avg). Then I think, a bounce up from 1600 to back test broken resistance...maybe in the 1700s area before another sizeable move down into the low 1500s.
Given I believe we are in a 3-leg upwards B wave that decomposes into A=C, then I am expecting a down wave to commence starting this week and into the end of October. I am expecting November to open weak but bounce up into Thanksgiving, then December weak(?)


Tuesday, October 15, 2013
10/15/13: Possible H&S forming
Nothing new to add really except there is a potential H&S is forming on the hourly. Neckline is approximately 1697. There is the potential for a pop tomorrow morning into early morning which is the next timing window. If that's the case, I will be looking to add to shorts at the timing window.


Monday, October 14, 2013
10/14/13: Switched to short, looking for 1670s
Markets gapped down at the timing window (green line) which was different from what I expected. If it was a high, I would have shorted but instead markets gapped down so I had no choice but to buy some more SPX.
Towards the end of the day, we started sporting some negative divs on the hourly so took off longs and switched to small short. Currently STILL looking for a retrace back to 1670 area.
If this rally is for real, we need to see a test of support. So far, this rally has just gone up in one straight line without a true test of broken resistance. Rallies like these are very "suspect" and we could potentially label this as a wave B rather than the start of a new rally.
So while I hope / expect new highs, I am open to the idea that this may in fact just be some false "B" rally. Again, need to see some testing of support otherwise hard to trust.

Friday, October 11, 2013
10/11/13: Looking for 50% fib correction and then off to the races
Closed that small short at the beginning of the day for very minor loss. Support was better than I thought and jumped on some more longs but in hindsight, wish I was bigger. Wave looks fresh for a correction so since the timing window is at the open Monday next week, if we get a nice pop on Monday, then I'm looking to short it for a correction down to the 200 MA hourly by mid week.

200 hourly looking like prime support right now and market would need to get a nice correction to get more momentum to the upside.
CCI short term is sporting negative div still while cycle is turning up so looking for that short term correction and then giddy up for some wave C (or wave 3 for alt count) action. Either way, the next wave is looking like at least another 2+% up.
Leads me to believe a more concrete govt plan gets done this weekend but on Monday there are realizations that there is not enough agreement on the debt ceiling. Then, lo and behold, congress figures something out in the minutes to the deadline coinciding with a blast off for the indices. We have seen this type of stuff before. Just watch the price action....we get a nice correction into 10/17, I'm buying that no doubt.
My thinking for next 1-2 weeks is in red arrow/green arrow.

Thursday, October 10, 2013
10/10/13: Small short at EOD, start of bullish wave
I closed out a bunch of longs today in the short term trading account and started a small short at EOD. It looks like a practically complete 5 waves up so I'm taking a stab at a possible wave 2 unfolding.
Given the magnitude of this wave (wow, I can't quite remember a bullish move like today start to finish), I feel like a small correction is worth a small short. Even taking 38% of 2+% move is not a bad call to wager especially when there are small negative divergences forming.
Nevertheless, this small short is very short term, and I'm looking to get bigger long on a decent pullback.
If we are in a bigger wave B then if this first leg of wave B was 2+% then once can expect the third leg to be ~2+% as well. This would put us either at a double top or a new high. I'm hoping for new high but taking this a day at a time.
We have negative divs on the short term CCI and the short term aroon oscilator. There is also the possibility of a negative reversal on the medium term CCI. However, given the daily chart shows this as a massive bullish belt hold, I am inclined to believe that given what the various indicators are suggesting, it's a very short term pullback and then another run up.
I'm still in the camp looking for a new 52 week high.

Tuesday, October 8, 2013
10/8/13: Assessment was incorrect, still fishing for a bottom
Markets really took me by surprise today. Like I said, if market opened marginally lower, I would buy so I did. Then during the day I watched it break hourly support line after support line and trend down on the 10 minute chart. Not my day but hopefully the next few days will be better. I bought a bit more at the EOD.
Looks like a falling wedge formed so we may pop tomorrow in the morning and then get beaten down again. If the timing window is any indication, if we do see pop and drop, then I'm looking for a low to be put in the afternoon.
What concerns me is the 50/200 hourly cross and if we broke major trend lines. It's hard to tell unless we are 3-4% away from support. 1-2% is noise so it's not official yet if we broke major support trendlines.

Monday, October 7, 2013
10/7/13: Closed hedge, added long, looking to add tomorrow
Still no resolution to the govt shutdown, now all eyes are on the debt ceiling. This whole shutdown has been so confusing, I have no idea where it stands now.
Saw this headline below...how many times have we seen website after website calling for massive recession?
http://blogs.marketwatch.com/thetell/2013/10/07/a-one-month-shutdown-risks-triggering-20-to-30-correction-barry-ritholtz/
Both the weekly and the monthly charts are still in a big time uptrend. If you look at the August 2011, price action was weak for several months before the head and shoulders on the weekly came to fruition. Currently we are nowhere near a similar type of setup on the weekly or monthly.
The daily has been weak but is already oversold near trendline support. Hard to argue for a break of support here.
Anyway, closed out the short hedge, and added to long at the open. Waiting for tomorrow's open to decide what to do. If we open marginally lower, I add to longs. If big gap down, I have stops in place to account for that scenario (though unlikely). If we gap up, let the longs run. If we are up marginally then I want to wait and see for a bit longer before making a move during the day.

Saturday, October 5, 2013
10/5/13: Hedging longs, looking for ST pullback, then another rally
No resolution on the government shutdown yet so market is acting erratic. However, as more time progresses, it would become more clear to market participants when a bill passed and we are back to normal again.
Judging by the way the markets are setting up, I think a resolution to this matter is likely this week. Why I feel this way is because the ADX is almost crawling on the floor. Periods of consolidation/confusion precede big rallies (in one direction or the other).
It seems that markets have priced in the worst of this shutdown already and frankly it hasn't been much of a factor. If it was more pressing, we should be seeing a far larger correction, not this shallow sharp version.
Anyway, I hedged my longs towards the end of the day (marked in purple arrow for hedge). I am looking for a pull back on Monday but likely not exceeding the low we witnessed earlier this week. Afterwards, I plan on taking off the hedge and adding to longs. My expectations remain a higher high > 1720s but not sure when exactly
I'm hedging rather than outright short because CCIs are displaying negative reversal potential (higher high on indicator but lower high on price). Additionally, price action seems to be mapping out a rising wedge. However, on the flipside, aroon oscillator has been progressing moving higher so it gives me a bit of caution moving into next week.

Tuesday, October 1, 2013
10/01/13: Small long position heading into tomorrow
Government shutdown was expected based on all the dealings going around. Now that this is a reality, market is looking ahead.
Today, SPX bounded up +0.80%. I think now there is more upside to be seen in SPX. On the hourly, it looks like a small irregular shaped inverted head and shoulders. I think the setup is favorable for bulls here. A lot of fear and negativity went into the government shutdown and well, you buy when people are fearful and sell when people get greedy.
I've been playing a lot of short term trades (I added a bunch of markers for trades). It is hard to post in real time so I probably don't have much credence but so far some of these small trades have gone favorably.
If the inverted H&S plays to fruition then we should see a rapid rise into SPX 1715 give or take. Ultimately, I think we see another new all time high by the time this month is over (1750).
On another note, we ended today with a very blatant positive reversal setup on aroon oscillator (aroon osc made new low but price made higher low). I love aroon, I think it's one of the best indicators out there as long as you know how to use it and incorporate with other indicators.

Sunday, September 29, 2013
09/29/13: Haven't updated awhile, seeing continued downside into Tuesday
Been busy in my personal life recently so haven't had much thought in updating the blog frankly. Anyway, decided to put up a quick update. Futures look like they are down ~75bps, mostly because of the likely government shutdown (or maybe because we entered into a down cycle long before?).
I don't really delve into the politics since I just care about being on the right side of the trade. I did initiate a small short on Friday so unless something magical happens between now and the open, this trade should be in the money (overall, still burnt by the 9/18 rally so in the grand scheme of things, just trying to make back the money I lost on that day).
I've also started playing around with the gold miners (NUGT and DUST). Not for the faint of heart. Even for someone like me who plays around with SPXU and UPRO, the volatility in NUGT/DUST can be ridiculous. The reason I entered into the fray is because I really think NUGT is near or at the bottom of this long awaited cycle. I certainly could be incorrect but right now, as it stands, I think NUGT stands a good chance of seeing a healthy rally. Anyway, time will tell.
Looking for UPRO to fill the gap around 71 which is the SPX equivalent of 1674.

Sunday, September 15, 2013
09/16/13: Up into Tuesday, tomorrow is going to suck (for bears)
After a dismal weekly performance, I went back to the drawing board to revise the system. A system that fails to identify these strong trends is worthless in my opinion, so given the fact that my system missed this rally (and was on the opposite side) it was time to review.
I reviewed quite a bit over the weekend and was looking forward to starting anew, but today when I looked at futures, Eminis are rallying 1+%. Holy cow, that's going to suck tomorrow. Thought there might be a reprieve to cover the shorts at a better price so now I'm pissed I'm going to cover at worse prices.
There were a couple problems with my system
1. In the v2, I would take positions at the start of the timing window. Initially I thought this was ok, but instead I really ought to take action at the close of the timing window.
The reason is there have been a few instances in this rally (and others) where it seems the Aroon 3 flips from positive to negative (or vice versa) by the time the hourly bar is done. If the Aroon 3 turns negative, then I want to be taking the opposite position (if Aroon is negative, go long and conversely if Aroon is positive, go short).
A recent example is the hourly close on September 6th. The hourly bar flipped Aroon to negative but at the start it was positive. Hence why I took a short position at the start. What should have been done was taking a long position at the close.
If I had taken the long, then I wouldn't have been entering the next leg of the wave short.
2. the other problem was holding onto these shorts far too long. I violated one of the basic tenets in not honoring my stops. Really bad sequence of events this past week and a half.
Anyway, here's looking forward to the next several months.
Wednesday, September 11, 2013
09/11/13: Instead of a high at 10am EST, we had a low - ST long
Offset a couple batches of shorts with one batch of long so net short 1 batch of shorts. Today we ended up getting a low at 10am EST rather than a high. Given the low at the timing window, it looks like this wave doesn't want to relent.
After surpassing 1687, the next target is approximately 1697 which is the upward sloping backtest.
The next timing window is 9/13. Perhaps the high occurs on 9/13? We have a full moon heading into 9/18 so that's a possibility.
.png)
After surpassing 1687, the next target is approximately 1697 which is the upward sloping backtest.
The next timing window is 9/13. Perhaps the high occurs on 9/13? We have a full moon heading into 9/18 so that's a possibility.
.png)
Tuesday, September 10, 2013
09/10/13: Possible high tomorrow 10am EST
Markets popped at the open and never looked back. Hourly OBV on the SPX broke its downtrend materially by the end of the day. However, there is still a significant divergence between hourly OBV and where price is at.
SPX OBV is at a level below 1660.51 which was the high back on 8/26 pre-Kerry speech. SPX needs to keep pushing forward for the next several days in order to wipe out this divergence, but this seems really unlikely.
Since OBV is showing negative divergence, I am waiting for a move down below 1660.51 at minimum. Don't get me wrong, long term this market is UP. My long term accounts are all in SPX but swing trade on the short term account.
These waves are the worst in my opinion because they are designed to second guess your thesis. Such a strong, impulsive move makes you wonder if this is start of some wave 3 of 1, but it's so damn close to where you think resistance is and where this wave ought to stop.
Looking forward to tomorrow, timing window is at 10am EST. Possible high? If it's a high then I'm looking for a move down into 9/13 which is the next timing window.
The saving grace I have is the UPRO hourly OBV. UPRO still hasn't broken its downtrend OBV. I am not sure if leveraged ETFs hourly OBV is reliable but am taking a look here.


Monday, September 9, 2013
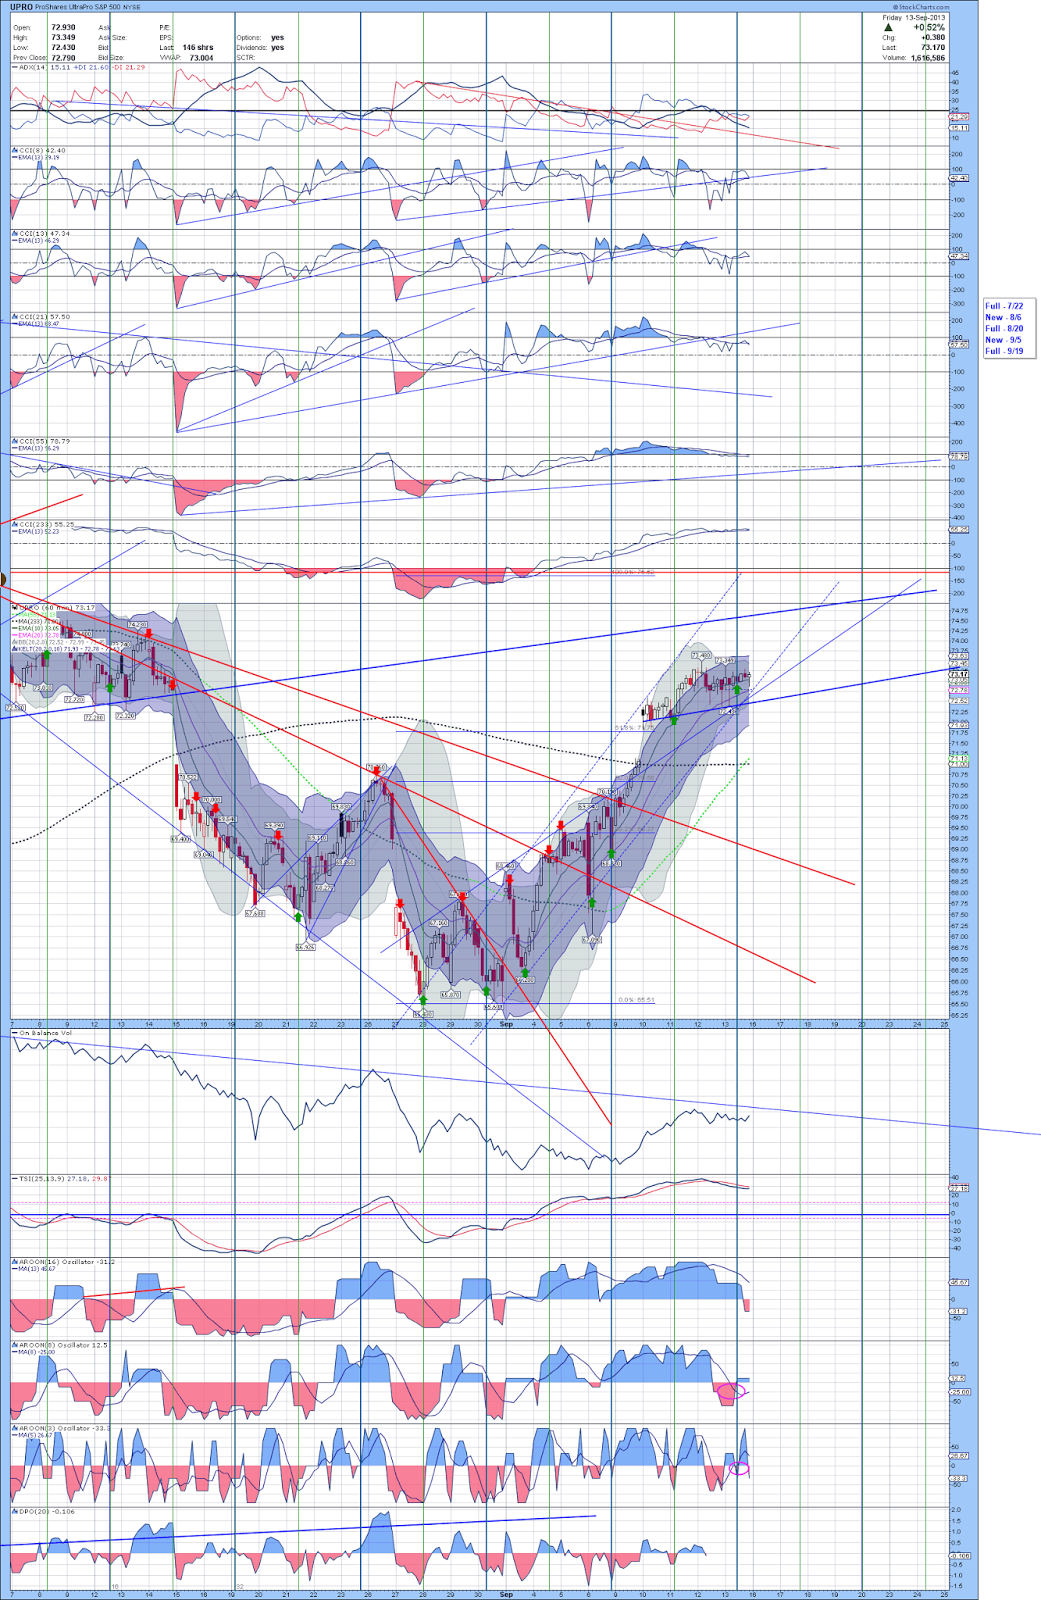
09/09/13: Tomorrow's opening half hour is very important
There are two items I am watching heading into tomorrow's kiddie hour
1. Hourly OBV trend (circled in pink)
2. 233 hour moving average
Why these two? Today's move had us closing right at the edge of the OBV downtrend. Price meanwhile broke it's downtrend AND also closed above its 200 hour moving average. Does this mean that the bears are toast and the bulls have it all?
It is hard to say until all evidence unequivocally points to one direction. Right now, the bulls have price in its favor but volume has not supported the break yet.
Why I say the kiddie hour is going to be important is because if we close the kiddie hour with a strong move up then it is off to the races because OBV would break its downtrend. If, however, either of the following happens, then we have a possible failure and the resumption of the downtrend:
1. Pop and drop: maybe some data point is bullish or someone says something which causes markets to pop at the open. If bears don't beat it down then this wave up may in fact be bullish.
2. Gap down: I would totally prefer this since it leaves no doubt on the table that new lows will be visited.
The second item I listed is the 233 hour moving average. Why do I use the 233 hour moving average? First of all, 200 MA is widely used by novices and is the default setting for many software. To get somewhere in this game, you gotta take some chances at looking at other angles. You may do your due diligence on this but you'll notice the 233 MA is very good at tough resistance or support.
You may notice if you have the 200 MA set, we closed above that on an hourly basis. This would tell a lot of people to be bullish but look at the 233 MA! SPX failed to close above. It tried once and got beaten down and it tried again in the final hour.
Therefore, these two are very important going into tomorrow's open. Good luck.

Sunday, September 8, 2013
09/08/13: Looking ahead to this week
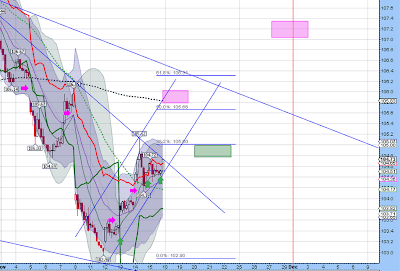
To me, SPX is nearing completion of this rising bearish wedge which, after completion, targets the origin of the bearish rising edge...in this case 1620s.
My belief is that we are still in Wave B of intermediate wave iv. This means a devastating C wave is yet to start. The preliminary target is around 1580. I believe this will generate enough bearish sentiment to give the markets one large wave up.
Looking towards Monday, there is the potential for the markets to test 1661 and maybe move up to 1666 again. This would not violate the rules of the bearish wedge. If there is enough euphoria build up, then it's possible to see 1670s. I am keeping this in mind since I am always thinking about risk management.
Currently holding 2.5 lots of short SPX (via SPXU). The entries are marked with the red arrows. The next timing window is the 11th.

Wednesday, September 4, 2013
09/04/13: Shorting SPX, looking for lower low ~1600
We've had a roller coaster ride the past couple of days with serious swings on both sides.
To me, the market is probably completing a wave B of iv. If that is the case, then we should be peaking soon and then another swift move lower (approximately 80 points if A=C) to take us to roughly 1580. Whatever it is, it is likely below 1600.
I really don't think we are going to new highs yet. The scenario I am going off of is we move down to 1580s late September which is right around where super-long term support is now (this is the meridian line dating back to the 1930s). We crossed that resistance line before the Boston bombings and the bombings took us down to support level. After the test, markets rallied huge and are now in this more expansive corrective pattern.
If 1580s holds, then we are likely heading > 1705, maybe to 1750. That would be ideal in my opinion. If we fail (really don't want to get into this whole Syrian mess), then we could be ushering in a brutal bear trend.
Anyway, I've marked in pink where possible grind higher could go. OBV is showing a disconnect here...it's made lower lows but price hasn't. Usually OBV is a leading indicator and tells us we are heading lower.

Thursday, August 29, 2013
08/29/13: Hoping to open low and then rally up to 1650s
Been awhile since I updated.
Currently markets trying to digest all the negativity in the news. I like the volatility but I hope there is no war, and nothing comes out of all this.
SPX looks like it's setting up a expanding wedge. According to Bulkowski, breakdowns occur 70+% of the time but first we need another hit of the upward sloping wedge.
If that's the case, then we should see somewhere in the 1650s and then a breakdown. However, what if it's a partial decline? In that case, we may see prices rally all the way up to 1680s. Not out of the ordinary. All it takes is someone to say "no strike."
So right now, thinking target first is 1650s but I want tomorrow to open slightly lower...better entry.
After 1650s, the odds are in favor of a trip south but maybe that's not the case this time. Not that there is a new moon around 9/5 so maybe prices fly into 9/5. Let's see.

Tuesday, August 13, 2013
08/13/13: Back on the bull train
Today's move down after the open took me a bit by surprise. I thought perhaps the market was going to break neckline and make a wicked H&S. Instead, I decided that there were some bullish divergences forming so I took a UPRO position.
Currently sitting with UPRO and holding into tomorrow. The timing window is EOD 8/14. The next one after that is EOD 8/16 or open on 8/19.
My gut instinct is telling me markets are making one final attempt at the high. We still have this open gap at ~1705. Hoping that gets filled. That may be an ideal target for this last attempt up.
.png)
Friday, August 9, 2013
Tuesday, August 6, 2013
08/06/13: Still looking for a higher high
Markets were significantly oversold today on a relative basis. What this means is if we do achieve a lower low, this will set up a significant positive divergence that could be the springboard to higher highs.
Secondly, today we have a "positive reversal." The CCIs on all timeframes were significantly oversold relative to the most recent CCI low however price is making a higher low. This means that the sell off was not strong enough to drive price lower, and bears did not get the job done.
This setup is very prone to a short squeeze. It could be last leg of this particular wave.
Still holding UPRO but today really put a damper since I bought at the close yesterday and today we had a gap down and a drive lower.
Again, still looking for a higher high.
.png)
Tuesday, July 30, 2013
07/30/13: Bought 1 lot size UPRO
Avg price @ 73.08. Stop set for 70, may tweak that a bit later, but preliminary stop is 70.
Saturday, July 27, 2013
07/27/13: Further review, looking for markets to go higher into 8/6
Upon further review, I realized an important part of the system needed some tweaking particularly when the last bar in the timing window overlaps with a large red or white candle.
The system looks at the previous bar before timing window and will help me determine what do at the timing window. I didn't follow my system this go around which is a no-no if I want to get this to work on a more consistent basis. The big red candle that occurred exactly on the timing window threw off what I was looking at.
In other words, we really should be long right now.
I am making a mental note that we should be long, and the mental short I had on should have been closed. Counting this as a loss given I didn't follow the system.
Based on divergences, I am looking at markets moving up into 8/6 window. This overlaps with a major timing window + new moon. Might get interesting after 8/6.
Friday, July 26, 2013
07/26/13: timing window just passed, remaining on a short (mental note)
Would move SPXU stop up to $20.80.
Wednesday, July 24, 2013
07/24/2013: short SPX (mental note, no trade)
For whatever reason, the signal, right now to me at least, is another short SPX opportunity. The first time recently was stopped out and this time it is trying another short. The entry would have been ~$20.70 on SPXU.
I have no trades on since I am on a trade blackout until 7/31. However, I am mentally noting that this timing window was a short, and the next one is coming up on Friday.
.png)
I have no trades on since I am on a trade blackout until 7/31. However, I am mentally noting that this timing window was a short, and the next one is coming up on Friday.
.png)
Monday, July 22, 2013
07/22/2013: Stopped out on SPXU
Sitting in cash. I probably won't be trading until after 7/31. Will be looking to move some balances around. Will post my thoughts at the next timing window however.
Friday, July 19, 2013
07/19/13: Bought other 1/2 lot of SPXU @ $20.98
Moved stop up to $20.59 given larger size.
So now have 2 full SPXU lots @ $21.09 avg price
So now have 2 full SPXU lots @ $21.09 avg price
Wednesday, July 17, 2013
Tuesday, July 16, 2013
07/16/13: Stopped out @ $71.30 UPRO
Flat now. Bought at $71.26, exit at $71.30. Sitting in cash and waiting for 7/17 10am.
Monday, July 15, 2013
07/15/13: Holding long - waiting for 7/17
Eked out some gains today as the market inched forward and moved stop up to protect gains (provided we don't have a nasty gap down tomorrow)
Market is up 12 out of the past 14 trading days and has ramped from 1560 all the way to 1680. 120 points in 14 trading days. Seriously crazy but you know, it is what it is.
In the big picture, this could still be one nasty B wave before an even nastier wave C. I don't know why people are arguing for a wave 1 here, it's too sharp and too fast for wave 1. B waves can overlap and exceed the start of wave A which was 1687.
The next "possible" turn is 7/17 at around 10am on my chart. This is really interesting because Bernanke is supposed to testify at...coincidentally...10am on 7/17.
http://news.yahoo.com/bernanke-deliver-semi-annual-testimony-congress-july-17-143031686.html
I always say "possible" because my positioning depends on how price moves into that timing window. My hunch is it's down after 7/17 but if we gap up on 7/17 I will reconsider.
Friday, July 12, 2013
07/12/13: Closed short, opened long, late to the party
Markets have gone on a tear plowing through every target thrown at it. Markets never cease to humble the most steadfast traders. I can't imagine all the shorts getting creamed in this massive runup.
Don't give up. Learn from your mistakes. Fail and fail a lot but learn from those mistakes.
I am switching to posting UPRO and SPXU charts. It is much easier to chart expected targets after gaps form. They also give me a better idea on the CCI charts.
The next timing window is at the open 7/15 so I opened a long UPRO at the start of the last hour. To my delight, SPX popped huge relatively speaking at the start of the hour. Is it possible that I am reading the right cycle? How did it start the moment I put on a trade? Anyway, the disappointment is that UPRO ended only +0.03% while SPX finished +0.31%, WHAT THE HELL??? I guess that's the risk you take in participating in these levered instruments, but I am usually in them for very short amount of time.
Entry: standard size UPRO @ 71.26
Exit?
Stop: UPRO @ 68.45 (setting this to below the start of the gap)
Next timing window: open @ 7/15 Monday
Next major window: morning @ 7/17 Wednesday (Bernanke semi-annual meeting)
.png)
Wednesday, July 10, 2013
7/10/13: still holding short - widening stop to 1670 *risky*
Underwater on the short. I need to pay more attention to the gaps that are occurring.
The most recent gap from the 8th which I've pointed to with a pink arrow suggests a target of 1660:
1632 - 1605 = 27 points. Add 27 points to 1632 = 1632 + 27 = ~1660
The ubiquitous A = C calculation that I have seen floating around on the blogosphere remains either 1661 or 1665. A is the wave from 1560 -> 1620 and C is the wave from 1601 to ? or 1605 to ?
The wave from 1560 -> 1626 (high) took 2.5 timing windows.
If we take 1605 (the most recent major low) and expand out 2.5 (A = C on time), then this implies some sort of high tomorrow 7/11.
Futures are hella green which is making me slightly nervous. We shall see tomorrow at the open.
.png)
Monday, July 8, 2013
07/08/13: Took a short position at noon - holding into the 7/10 window, stop > 1660.
I took a short position at around noon as price entered a new high into the timing window.
The gap wasn't uber bullish but it wasn't muted either. Somewhere in between but it gives me a better idea that the uber-bullish scenario isn't as likely anymore.
Price is hanging by a thread at the breakout of the upper resistance line of the two recent highs. It is looking almost exactly like a textbook expanding diagonal triangle. This implies a breakdown into 1610 zone.
Saturday, July 6, 2013
07/06/13: Outlook for week of 7/8 - looking for creep up to 1635 then short
In the previous post, I mentioned a low on 7/2 and then a rally into 7/7 (or technically 7/8). So far this has been going as planned except the price target for the low was off.
Moving forward, I will refrain from giving general price targets. INSTEAD, the timing windows are absolutely more important. You will see why given we have a multitude of possible price targets, hard to pinpoint exactly what happens.
In the chart below, I removed RSI and MACD. These are basically standard indicators and I hardly use them anymore, so I replaced them with Aroon Oscillator for help in looking at possible cycle lows and highs before DPO.
The next timing window is noon 7/8. The next major window is end of day 7/10. The timing windows continue to indicate a high into 7/8 noon, and then a low 7/10. Let's run through the possible scenarios. I think giving price targets may indirectly influence trading decisions. As long as we see a high or a low into the timing window, then we know the appropriate trading decision to make (the opposite).
1. Scenario 1: uber bullish - gap up on Monday, we reach somewhere around 1650 and move up to 1655.
As we move into the timing window noon for this, we must be watchful of CCI 233. If it's sky high around 100, we will refrain from shorting. On the other hand, if it's muted (below 100), then we take a short position for the retrace to fill the gap.
This scenario indicates that we were DONE with wave iv and are proceeding with wave v to new highs above 1687.
2. Scenario 2: Bearish - muted open, creep up to 1635.
Under this scenario, the expanding diagonal pattern becomes possible. This means that a muted creep up to 1635 suggests a short term high is in. You would want to take a short position into noon for a retrace back to 1605 and possibly lower. A significant trend change would occur if TSI < 0.
3. Scenario 3: Sideways - down into the timing window noon 7/8.
If this occurs, which I give fairly low odds on unless something newsworthy comes out during the weekend, we have ourselves a bounce to play into 7/10, then short that bounce
What's my take? I'm going with Scenario 2. Reason being is we have some negative divergences forming on the hourly CCI. What is giving me hesitation is that the gap on 6/28 implies a move up to 1650s. Additionally, IF we are still in wave B of wave iv, then the target of this if A=C is still roughly 1660-1665.
In short, wait until noon 7/8!

.png)
Moving forward, I will refrain from giving general price targets. INSTEAD, the timing windows are absolutely more important. You will see why given we have a multitude of possible price targets, hard to pinpoint exactly what happens.
In the chart below, I removed RSI and MACD. These are basically standard indicators and I hardly use them anymore, so I replaced them with Aroon Oscillator for help in looking at possible cycle lows and highs before DPO.
The next timing window is noon 7/8. The next major window is end of day 7/10. The timing windows continue to indicate a high into 7/8 noon, and then a low 7/10. Let's run through the possible scenarios. I think giving price targets may indirectly influence trading decisions. As long as we see a high or a low into the timing window, then we know the appropriate trading decision to make (the opposite).
1. Scenario 1: uber bullish - gap up on Monday, we reach somewhere around 1650 and move up to 1655.
As we move into the timing window noon for this, we must be watchful of CCI 233. If it's sky high around 100, we will refrain from shorting. On the other hand, if it's muted (below 100), then we take a short position for the retrace to fill the gap.
This scenario indicates that we were DONE with wave iv and are proceeding with wave v to new highs above 1687.
2. Scenario 2: Bearish - muted open, creep up to 1635.
Under this scenario, the expanding diagonal pattern becomes possible. This means that a muted creep up to 1635 suggests a short term high is in. You would want to take a short position into noon for a retrace back to 1605 and possibly lower. A significant trend change would occur if TSI < 0.
3. Scenario 3: Sideways - down into the timing window noon 7/8.
If this occurs, which I give fairly low odds on unless something newsworthy comes out during the weekend, we have ourselves a bounce to play into 7/10, then short that bounce
What's my take? I'm going with Scenario 2. Reason being is we have some negative divergences forming on the hourly CCI. What is giving me hesitation is that the gap on 6/28 implies a move up to 1650s. Additionally, IF we are still in wave B of wave iv, then the target of this if A=C is still roughly 1660-1665.
In short, wait until noon 7/8!
.png)
Sunday, June 30, 2013
06/30/13: Holding short - 1580 then 1635
As we open July 1, I am looking for a dip into 7/2 to 1580 and then a rally into July 8th to 1635.
I'm basing this information on the cycle timing windows. We just went into a high on the 28th so the next two days I'm looking lower into the July 2nd timing window.
However we have a new moon coming 7/7. Typically markets have rallied two days before the new moon so I don't see any reason why we won't rally after the low on the 2nd.
Stay nimble, short term trades only.
.png)
Thursday, June 27, 2013
06/27/13: Outlook incorrect, holding short however
Limited upside remaining however given how this rally has moved past my timing window, I have no choice but to concede that we would move a little bit higher giving me a bit more "pain" on the shorts and me admitting that the next few days outlook was incorrect
Based on the new information received after this morning's gap...we have several price targets for upside tomorrow:
1. The 2nd gap at 1590 met its implict price objective: you take the 1560->1590 then double it gives you 1620.
2. The latest 3rd gap takes this a step further. This gap was 1605. 1560->1605 = 45 point move so 1605+45 = 1650 is a high upside target. Realistically it appears that 1635 is achievable (equal length waves 1560->1590 then add 30 points to the 1605 gap = 1635).
3. Gap is at 1625-1629. Given the viciousness of the previous move, I am speculating that market participants would find that a prime opportunity to get out of longs.
However....
- Daily NYMO is hitting the upper BB and is also sporting a fat negative reversal (velocity of momentum oscillator much faster than price...can't continue forever).
- Hourly OBV is showing we should be back at 1580 because we're back at the declining channel. Note that I am not SUPER bearish but bearish currently given how at a very basic level, the major moving averages on the hourly and the daily are trending DOWN. This tells me to take higher risk on the short side, less risk on the long side until the moving averages switch.
.png)
Wednesday, June 26, 2013
06/26/13: Re-shorting at 1600-1610
Loaded big shorts with another batch ready just in case we do reach the original target of 1620s.
CORRECTION: I'm starting to believe that we are in wave 2 of the bigger wave C wave rather than starting wave 3 of C.
I am currently looking for a dip down into 1580 then another launch up into 1620-1630. This would coincide with the declining 200 hour moving average.
So down into end of June and then up into July 3rd, the day before Independence Day.
After that I think that could be the start of wave 3 of C.
We shall see!
Saturday, June 22, 2013
06/22/13: Wave C under way, looking for 1620s to short
Markets didn't quite reach my original target of 1660-1670. 1650s was where all the calculations had pinpointed to but I guess I was wrong in thinking that there would be a stab to get above these resistance levels.
Nevertheless, the market reacted in that zone and is now trading back under 1600 on the SPX.
I got stopped out after markets crossed under 1650 very quickly and switched to a short. However, I only held that until 1620. Pretty bad trading on my part since my plan was always that we were completing a wave B and then undergoing a brutal wave C.
Afterwards I started buying to play a bounce but the downdraft was more significant than I originally planned for.
Wave C has been brutal and now I am trying to play the bounce up to the gap zone of 1620s. There is a legitimate change that the market has temporarily bottomed and is looking to retrace back up to 1620 this week. On the 10 minute, there is a clear nested IHS built on oversold conditions. Target is 1620 Monday.
Afterwards, this should reset the short term indicators to overbought but long term oversold. I am planning to short at the 1620 level (if it can really get there) and ride this wave C down to 1540s.
.png)
Monday, June 17, 2013
06/17/13: Maintain 1660-1670 target...late 6/19 - 6/21
The cycles are starting to get a bit clearer for this week.
We are also seeing a lot of resistance lines converging.
- The channel that is forming currently is pointing towards 1660-1670 by the 20th.
- This is also the underbelly of the large channel created from the November lows.
- It is also the underbelly of the broken triangle support line from late May.
Not only that but OBV is at the same level as 1661 thereabouts.
CCI trends seem to top off in the 20th to early 24th timeframe but downside pressure starting to build after that. It seems that either the top of this B wave is 19th / FOMC day or early 20th.
I will be refraining from shorting until then. In the meantime, I intend to stay long but will be passing out my longs to complacent bulls in a couple days.
Expect a lot of volatility around FOMC.
.png)
Friday, June 14, 2013
06/14/13: Outlook for week of the 17th - 1660 then down
Next week is shaping up to be quite the roller coaster again. We have the FOMC meeting, housing, along with opex. If you like to trade volatility, next week should be no different from the past couple of weeks.
Currently, I believe we are still in the middle of intermediate wave iv. Wave A finished at 1598 and we are in the process of finishing wave B which I believe is targeting somewhere > 1648 (1660-1670) before falling off a cliff the week after.
Monday is looking neutral. I don't really have a conviction either way if it's up or not. However, overall, the week is looking bullish into mid week coinciding with the FOMC meetings before tanking and starting the wave C we are waiting for.
I've noticed many people are seeing a triangle forming which implies further downside below 1608 and consequently below 1598 and that there little probability of revisiting 1650. My view is although there is a triangle, this could in fact form a bear flag that connects the two most recent lows and with the top of the channel the underbelly of the broken channel that began from the November 2012 low. This implies that we see prices revisit 1650 and further.
The rationale is:
1. Hourly OBV is making a series of higher highs and higher lows. Recently price action has only shown higher lows but not higher highs. I'm a believer that volume leads price and the bigger the divergence the more likely price will shoot up quickly.
Additionally, volume is testing resistance of the broken uptrend. Price is still way below. If price were to test the broken uptrend, this would be around 1660.
If we were in a triangle I would want to check the hourly OBV to confirm the pattern but it isn't.
----------
The following are notes I've mentally jotted down here...mostly just myself rambling away.
My view is we are STILL in wave B. If we break wave B further, I think A of B finished from 1598 -> 1648. wave B of B finished at 1608 (1648 -> 1608) and we are in the midst of wave C of B.
If A = C, then a target for the final move of wave C of B is 1608 + 50 = 1658.
If in fact, wave B finished at 1642.63 instead of 1648, then wave C is 1608 + 44 = 1652
There was the positive reversal on the CCI 233 that I mentioned earlier in the week. This coincided with the ramp from 1608 to 1640. If this is indeed valid then the positive reversal calculates the following target
1648.69 + (1612 - 1602) = 1658.69. (1612 and 1602 are ROUGH estimates of the closing hourly bar of the recent lows).
Depending on how you draw the channel from the November 2012 lows, it could be anywhere between 1653 and 1660. 1653 is also the 61.8% fib from 1687.18 to 1598.23. Hence a range of 1653-1660
The IHS where the neckline is formed roughly around 1637 and the neck starting from 1608 implies a target of 1666 if broken. 1637+(1637 - 1608) = 1666.
So now we have several targets mostly in the 1650-1670 range. The average of these seems to be roughly 1658. 1658 seems the more likely candidate for the bull case.
In terms of the bear case, I think at present time it is weak. It will turn strong later in the week but currently it is weak. I am only expecting 1615-1620 if we break lower on Monday. This would imply that we truly are in a triangle.
.png)
Wednesday, June 12, 2013
06/12/13: looking for a low at the open and then a rally up
No change really, still looking for that last ramp up to 1660-1670 then the waterfall down to 1540-1550.
We have multiple positive divergences on the shorter CCI timeframes and we are now finally sporting a positive reversal on the CCI 233. This implies higher prices > 1648 as long as the 1598 can hold...
Happy trading.

We have multiple positive divergences on the shorter CCI timeframes and we are now finally sporting a positive reversal on the CCI 233. This implies higher prices > 1648 as long as the 1598 can hold...
Happy trading.

Tuesday, June 11, 2013
06/11/13: long hedge, looking for visit to 1660-1670
Will try to update more often so it doesn't look like I'm picking and choosing. A lot of large items occurring...trying to buy a property for one is taking quite some time so have made fewer updates since then.
.png)
SPX has been making some serious volatile action. Perfect for day traders, a bit more complicated for swing traders.
Currently I believe the ramp from 1598 to 1642 is a wave A. Then the trip from 1648 to 1622 is a wave B expanded flat. We are currently in a wave C of this corrective move up. If A=C, and A was 44 points, then 44+ 1622 is approximately 1666.
Let's say we made wave A 1598 to 1648. This is +50 points. Then the trip from 1648 to 1622 is wave B then wave C is estimated to be 1622+50 = 1672.
The CCIs on the smaller timeframes are getting squeezed at the bottom, it's ripe to ramp again. Therefore, I am expecting a large move up tomorrow into 6/13.
However, according to the medium term cycles, the next move up (if it should end somewhere in 1660-1670), should really terminate this leg.
I am still holding some shorts but am hedged with this long position for the ramp for next couple days. After that I am prepared to build that short position a lot more to take advantage of what I think is the C wave of intermediate wave iv. It's going to get interesting.
.png)
Wednesday, June 5, 2013
06/05/13: continuing to short, looking for 1590-1600
Ever since my last post, SPX has dropped from the 1660s to 1610. This is approximately a 3-4% correction.
I was looking for 1680 but SPX failed a couple times...the more predominant one was post the triangle breakdown and retest of 1645. The CCI 8 recorded a negative reversal (CCI level was higher at 1645 than at 1660). This prompted further deterioration.
These reversals happen very quickly. For those who were thinking about 1680 (like me) it was a wake up call to reverse positions and go the other way.
When you think about trader psychology, it is during these instances when prices really fall (or rise) faster. The velocity of price deterioration has really woken up some sleepy, complacent bulls.
CCI shorter term cycles from 8->21 are all showing positive divergence however the longer term cycles HAVE NOT. In fact, longer term cycles are still projecting deteriorating price but I expect shorter term cycles to start making price "choppy."
NYMO recorded a close < -100. It's been awhile since we've seen one of these. The problem is NYMO isn't spiking. We have to wait for trend power to diminish (ADX) but it is in fact rising on the hourly chart. This indicates that while shorter term cycles are indicating a bounce (probably to retest failed levels 1620, 1630) those rallies should be shorted.
Target is somewhere below 1600. I think it fills the gap, and then when media starts piping SPX < 1600 it's time to load up because the bull train is going back up.
.png)
Subscribe to:
Posts (Atom)